Tariff rates vary widely by country and sector. According to the latest WTO data, the U.S. applied a 3.3% simple‐average MFN tariff on all imports in 2024 (with about 3.2% on U.S. agricultural goods and 3.1% on non‐agricultural goods). The EU’s overall MFN average is about 5.0% (roughly 10.5% on farm products and 4.1% on industrial goods). The UK’s averages are similar to the EU – roughly 3–4% overall (about 2.9% on agriculture, 4.1% on industry). Canada’s overall MFN tariff is ~6.6% (15.1% on farm imports, 5.1% on other goods). Japan’s all‐products MFN is ~3.9% (about 11.9% on food/agriculture, 2.4% on manufactured items).
China and other Asian economies also show typical patterns. China’s applied MFN duties average roughly 6–7%: about 7.5% on agricultural goods and 6.5% on non‐agriculture. South Korea’s overall MFN tariff is around 17.0% – reflecting exceptionally high farm levies (57% on average) and modest non‐ag tariffs (~9.8%). Vietnam, a highly export‐oriented economy with many FTAs (ASEAN, CPTPP, RCEP), has moderate MFN rates (~11.7% overall: ~17.0% for agriculture and 10.5% for other goods). By contrast, India’s tariffs remain the highest in this group: MFN averages are on the order of 36% for non‐ag goods and 50%+ for farm imports. In short, all‐goods MFN averages are roughly: US ~3.3%, EU ~5.0%, UK ~3.7%, Canada ~6.6%, Japan ~3.9%, South Korea ~17.0%, Vietnam ~11.7%. Key sectoral rates are higher: e.g. U.S. still has 25% duties on many steel/aluminum goods and a 15% rate on EU‐made autos (recently cut from 25%); India charges ~60% on cars and high duties on electronics; EU still levies ~10–25% on meats and dairy; and so on.
| Country | MFN (All goods) | MFN (Agriculture) | MFN (Non-Agri) |
|---|---|---|---|
| United States | 3.3% | 3.2% | 3.1% |
| China | – | 7.5% | 6.5% |
| European Union | 5.0% | 10.5% | 4.1% |
| United Kingdom | 3.7% | 2.9% | 4.1% |
| Canada | 6.6% | 15.1% | 5.1% |
| Japan | 3.9% | 11.9% | 2.4% |
| South Korea | 17.0% | 57.0% | 9.8% |
| Vietnam | 11.7% | 17.0% | 10.5% |
| India | – | 50.8% | 36.0% |
Table: WTO tariff data (2024 applied MFN), rounded. “–” indicates data not given. Sources: WTO World Tariff Profiles 2025.
Recent Trade Policy Shifts
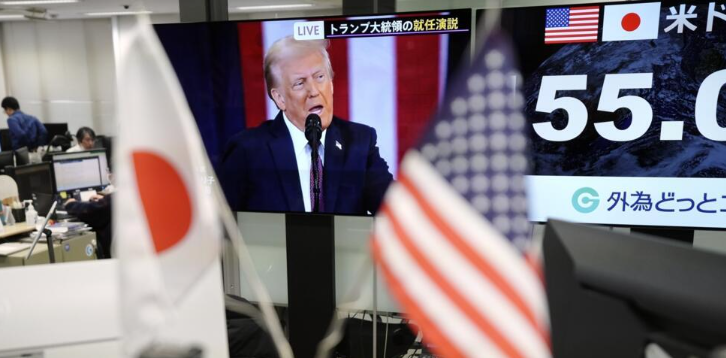
Since 2024, tariff policies have shifted dramatically. In Asia-Pacific, the RCEP and CPTPP agreements (involving Japan, Korea, China, Vietnam, etc.) entered into force or expanded, gradually eliminating many intra-regional duties (e.g. RCEP cut most tariffs among ASEAN, China, Japan, Korea from Jan. 2022). In mid-2025 the U.S. also pursued big bilateral pacts. Notably, President Trump announced “cooperation agreements” with Japan, South Korea and the EU. In September 2025, the U.S. formally implemented its July 2025 deal with Japan: U.S. auto tariffs on Japanese cars were cut from 27.5% to 15%, and Japan committed to ~$550 billion in U.S. investment. Similarly, a U.S.–South Korea trade deal (October 2025) set U.S. duties on Korean autos/parts at 15% (down from 25%) and guaranteed tariff parity for Korean semiconductors. In July 2025 the U.S. and EU agreed an historic pact: the EU agreed to eliminate most tariffs on U.S. industrial exports while accepting a 15% “reciprocal” ceiling on tariffs to the U.S. (including on autos, pharma, semiconductors). The U.S. reciprocated by cutting its tariff on EU-made cars from 25% to 15% (effective August 2025). That same July deal left U.S. steel/aluminum tariffs (50%) in place for the EU (to address “industrial excess capacity”).
Other recent changes: in May 2025 the U.S. imposed a uniform 10% tariff on most imports (the so-called “reciprocal tariff” on all trading partners), and in late 2025 it announced a new 25% tariff on heavy trucks (effective Nov.1, 2025). The U.S. also doubled duties on many Indian exports – for example raising levies on engineering goods to 50% from Aug 27, 2025 – as a reciprocal measure. China countered U.S. tariffs by first raising average duties on U.S. goods (peaking at 147% in spring 2025) and then agreeing to roll them back to ~32.6% following talks. Likewise the U.S. applied surcharges of up to 125% on various Chinese imports in early 2025 (e.g. on certain electronics, fibers, and ag products) before trimming them to a 10% tariff in May. In short, average U.S. duties on imports from China spiked (briefly exceeding 100%) but now stand near 57.6%, while China’s average on U.S. goods is ~32.6%. These tit‐for‐tat measures have yet to be fully resolved, but new trade pacts (RCEP, CPTPP, US-EU/US-Japan/US-Korea) have cut many tariffs among major trading partners.
Overview of Current Tariff Frameworks by Country
United States

The United States retains one of the lowest overall average MFN tariffs in the world (about 3.3% on all products), but its effective rates on specific imports are now very high. On Chinese imports the U.S. combines 25% “Section 232” steel and 10% aluminum tariffs with additional Section 301 duties. In 2024, USTR announced final increases that drive these higher: for example, Chinese steel and aluminum tariffs are set to triple from ~7.5% to ~22.5% on top of the 232 levies (making steel ~47.5% total). In strategic industries, tariffs have jumped steeply. As of late 2024, the U.S. imposes a 100% tariff on imported Chinese EVs (electric vehicles), and 50% on Chinese semiconductors and solar panels. Other products like lithium-ion batteries and critical minerals now face 25% duties. These moves are aimed at protecting U.S. industry (especially in clean energy) but make U.S. duties on these imports some of the highest in the world. For comparison, the U.S. still applies 2.5% on most general imports of cars, 16.5% on most apparel, etc., as per the old tariff schedule.
The U.S. has also faced its own retaliation scenario. After the Trump steel/aluminum tariffs in 2018, the EU and others imposed counter-tariffs on U.S. goods (e.g. 25% on bourbon and motorcycles). Many of these have since been lifted under USMCA and WTO settlements, but the episode underscored the risk of tit-for-tat. Today the U.S. returns fire mainly via case-by-case antidumping/countervail measures (e.g. on solar cells) and exclusion lists. Notably, Section 301 “fentanyl” tariffs (10–25% on Chinese chemicals and fabrics) have been scaled back as of late 2025. Thus the current U.S. tariff framework is a complex overlay of low general tariffs with selectively very high duties (especially on China). The U.S. average MFN rate of ~3.3% hides these sectoral spikes.
China

China’s applied tariffs remain higher than most advanced economies. Its overall MFN rate is roughly 10%, weighted toward agriculture and certain consumer goods. China responded to the U.S. trade war with its own broad retaliation: at the height of the conflict it imposed tariffs up to 25% on U.S. exports (soybeans, autos, etc.), though some of these were later reduced. On a product level, China maintains double‑digit rates on many agricultural imports (wheat ~13%, poultry ~50%, for example) and on cars (25% WTO-bound for passenger cars). For high-tech items, China’s applied tariffs on consumer electronics are mostly 0% (to facilitate technology uptake), but it does levy duties on some industrial and chemical imports. China has also begun to consider export restrictions rather than import tariffs – for example, tightening controls on rare earths and other critical minerals as leverage.
In recent years China has also cut tariffs under FTAs. RCEP and other deals have eliminated or reduced duties with regional partners (e.g. tariff-free for many ASEAN and Japanese products). Still, China retains high bound rates on some products for policy reasons (e.g. auto parts, luxury items). As a WTO member, China is formally committed to liberalization, but it has made selective use of its WTO-bound tariff ceilings (some as high as 50% on “chaebol-style” goods). In WTO disputes, China has both defended its own tariffs and challenged others’: for instance, Beijing recently filed WTO cases against the EU’s new tariffs on electric vehicles and solar panels, illustrating an assertive approach.
European Union

The European Union maintains a relatively low average tariff – around 5.0% across all products – reflecting its open trading stance. Most manufactured imports (electronics, machinery, autos) enter the EU duty-free or at very low rates (typically 0–4%). Agricultural and textile goods face higher rates (often 10–20% for meats, dairy, apparel, or up to 40% for sugar, tobacco, etc.). The EU did impose temporary safeguard quotas on steel (triggered in 2018) but ended them in 2020, relying instead on anti-dumping duties (for example, 25% on various Chinese steel products that violate EU AD rulings).
Since 2020, the EU has raised tariffs on a few strategic goods from China. Most notably, in late 2024 the Commission imposed countervailing duties on battery‑electric vehicles from China. These add 7.8–35.3% on top of the EU’s normal 10% car import tariff, resulting in total duties up to ~45%. The EU launched parallel anti‑dumping investigations on Chinese EVs and new investigations on solar panels, electric trains and motorcycles. Thus Chinese clean-tech imports now face rates rivaling U.S. levels. Elsewhere, the EU retaliated against U.S. Steel/Al tariffs by keeping in place duties on certain U.S. goods (e.g. up to 50% on steel, aluminum, whiskey) until those U.S. measures were lifted in 2021.
In brief, the EU’s MFN tariff framework is broadly moderate (5.0% overall), but it has carved out high duties on key traded products. The recent EV decision is a prime example: the EU explicitly states it will “redesign” its market in that sector, reflecting a move toward industrial policy. On trade rules, the EU insists on WTO-compliance: it has defended its anti-subsidy duties at the WTO and enjoys the convergence of FTAs (Japan, Vietnam, MERCOSUR pending) to sidestep the need for higher tariffs.
United Kingdom

Post-Brexit, the UK largely inherited the EU’s tariff regime but has begun to diverge slowly. The UK’s overall MFN tariff is about 3.7% (agriculture 8.8%, non-agriculture 2.9%), slightly lower than the old EU. It retains a 10% tariff on imports of passenger cars (mirroring the EU) and higher rates on agricultural products. Notably, the UK abolished many EU tariffs on intermediates and flat-packed items to promote trade (for example, a zero tariff on many components of electronics and machinery). The UK removed the EU’s safeguard on steel and set up its own quota system instead, but aligned its quotas with WTO levels.
Since 2020 the UK has made only limited tariff changes. It has joined many new trade pacts (notably CPTPP, which came into force in late 2023) that will gradually eliminate tariffs on a wide range of goods. It has also applied anti‑dumping duties on certain Chinese products (e.g. solar panels) and is reviewing EV tariffs as part of its “Industrial Strategy”. UK complaints about U.S. tariffs are minimal since the USMCA ended U.S. duties on UK exports. In summary, the UK’s current tariffs remain close to EU levels – in 2024 the MFN average was ~3.7% – but its long‑term trend is downward via new FTAs and strategic exemptions (e.g. extensive waivers for climate technologies).
Canada

Canada has one of the lowest average applied tariffs among large economies – roughly 3.8% overall (virtually 2.0% on industrial goods). In practice, 99.7% of Canadian tariff lines are duty-free, reflecting extensive liberalization through NAFTA/USMCA and other FTAs. Canadian tariffs on imports of manufactured goods are typically very low; for example, base rates on motor vehicles are 6.1% (though most imports from the U.S. and Mexico enter duty-free under USMCA). Canada’s remaining high tariffs are concentrated in a few protected sectors: dairy, poultry and eggs under supply management face effectively 250–300% duties, certain liquids (e.g. wine) are at 18%, and a few agricultural lines still top 30%.
Since 2020 Canada has mostly held its course. It rescinded the U.S. Section 232 steel and aluminum tariffs in 2018 (replacing them with quotas), and has not re-imposed them. Ottawa did impose a temporary safeguard on some steel products in 2020 (later repealed). Its short-lived tariffs on lumber from the U.S. were lifted in 2020 under a WTO ruling. Recently, Canada has focused on non-tariff measures (such as climate-adjustment taxes and labor procurement conditions) rather than raising general tariffs. In sum, Canada remains very open: its MFN tariff average is ~3.8% with almost all products entering free of duty, aside from strategic protective lines (dairy, poultry, select steel). Its trade policy emphasizes FTAs and supply‑chain security rather than new tariffs.
Japan
Japan’s applied tariffs are also quite low: about 3.7% overall (11.9% on agriculture, 2.4% on industrial goods). Japan eliminated most tariffs years ago under FTAs (notably the EU–Japan EPA and CPTPP). Its WTO-bound auto tariff is 25%, but under free trade agreements Japanese imports of cars from the U.S. and EU are largely tariff-free (so domestic tariffs on those goods are moot). Japan still imposes tariffs around 15% on most fish, meat and dairy; rice remains effectively closed (tariff-rate quotas at very high levels). It also has a unique 10% consumption tax on many products, which is not a tariff but functions similarly for imports.
Since 2020, Japan has not significantly raised general tariffs; in fact, it has been lowering them under FTAs (joining RCEP in 2022 further cut many regional tariffs). It did enact a special safeguard measure in 2020 to limit steel imports due to Chinese surges, but that was lifted within months. Instead of new tariffs, Japan’s strategy has been tariff liberalization plus non-tariff standards. It did temporarily ban some U.S. meat in 2018 (a sanitary measure after the trade war), but overall its tariff framework remains stable and WTO-compliant. In 2023 Japan’s MFN average was still about 3.7%, with most manufactured goods at 0–3% and only sensitive foods above 10%.
South Korea
South Korea’s tariff policy is relatively liberal on industry but protective in agriculture. Its overall MFN average is ~13.4%, mainly because it keeps very high rates on farm imports (averaging 57% on agri products and 6.5% on non-agri products). In practice, most industrial imports enter South Korea under free trade agreements (with the U.S., EU, ASEAN, RCEP partners, etc.), so applied duties on electronics, autos, machinery and other manufactures are often zero. Key exceptions are tariffs on textiles (~12%), shoes (~13%) and a few chemical products (where AD duties also apply). Rice, beef, and pork from abroad still face multiple barriers (multilayer protections with tariffs over 40–100%).
South Korea has not broadly retaliated with new tariffs since the trade war. It did oppose U.S. 232 measures at the WTO, but ended up agreeing to a quota on steel that took effect in 2021. Korea sometimes deploys tariffs for industrial strategy (e.g. modest increases on solar cells, EV batteries to nurture domestic firms). However, its general approach has been to keep to its FTA commitments. In sum, SK’s current tariffs are mostly the low rates (0–8%) it agreed with partners; only a few agri items carry very high duties. Its MFN applied tariff around 13.4% reflects large tariff-rate quotas on farm goods, not broad hikes on industry.
Vietnam
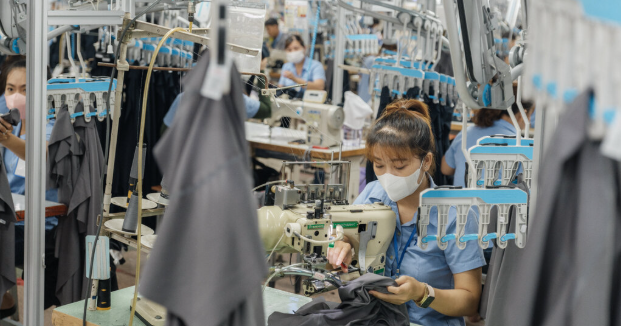
Vietnam’s tariff regime is moderately high by ASEAN standards. The overall MFN average is about 9.5% (17.0% on agriculture, 8.3% on manufactured goods). Under WTO accession, Vietnam liberalized many tariffs, but it still maintains significant duties: for example, 35% on some steel and cement, 10–20% on various textiles and footwear (often phased down under CPTPP and RCEP), and around 10–15% on machinery and electronics. Notably, Vietnam levies 0% on many basic raw materials to support its assembly sector (since final products fetch higher duties abroad).
Since 2020, Vietnam has steadily cut tariffs via FTAs (RCEP, CPTPP, ASEAN+ China upgrade) but has also used import duties defensively. It launched safeguard tariffs on Chinese chemicals and steel products in 2021–22 to protect local industry. It raised tariffs on some imported consumer goods (cars from China, batteries) amid trade tensions. But overall, Vietnam remains an open economy: 100% of non-ag tariff lines are duty-free as of 2024. Its tariff moves have focused on anti-dumping and safeguards rather than blanket rate hikes. The effect is that Vietnam’s external tariff looks very different by sector: most inputs are nearly free, while a few finished categories (textiles, leather, steel) are taxed to shelter local firms.
India
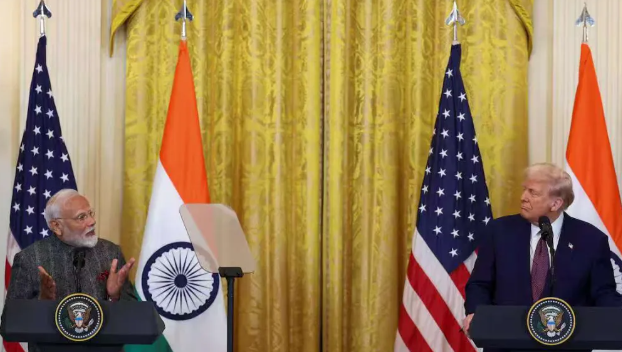
India is one of the most protected major economies. Its overall MFN tariff averaged roughly 17% in 2023, with very high duties on agricultural and consumer goods (39% on average for agri) and moderate ones on industry (13.5%). Key examples: tariffs on cars are 60–100%, many textiles/clothing around 10–20%, mobile phones 10%, electronics components 10–15%, and critical items like cement 28–30%. Alcoholic beverages are famously protected (rum 150%, whisky 150%, beer 100%). Agricultural tariffs are similarly steep: vegetable oils 30–40%, dairy products 30–60%, rice/soybeans around 40%.
Since 2020, India has generally raised tariffs to protect “Make in India” industries. In retaliation to the trade war, it imposed new duties on Chinese steel, aluminum and solar panels (e.g. solar cells at 70% and steel up to 12.5%). It also increased tariffs on some raw materials (steel billets, CMP slabs) to encourage domestic value addition. India’s strategy is often reciprocity-oriented: when the U.S. threatens or imposes tariffs, India points to its own high duties on U.S. exports. In practice, however, India avoids blanket trade war escalation: it did not match China’s full retaliatory list against U.S. electronics, for instance. Instead, New Delhi uses targeted measures (anti-dumping, countervail) against imports it deems unfair (e.g. solar cells, Chinese steel). Overall, India’s tariff framework remains among the world’s most restrictive: very high rates on agriculture and many imports, with gradual liberalization limited to sectors tied to FTAs (e.g. reduced tariffs on some Asian partners).
Sector-by-Sector Tariff Comparison
The table below highlights representative tariffs (MFN or applied) on key goods across these economies. Note that in practice many products enter at preferential rates, and some countries have quotas or exemptions (see notes). Still, these figures illustrate the rough magnitudes of protection:
| Product (HS Code) | USA | China | EU | UK | Canada | Japan | S. Korea | Vietnam | India |
|---|---|---|---|---|---|---|---|---|---|
| Smartphones (HS85.17) | 0% | ~0% (most phones) | 0% (MFN) | 0% (MFN) | 0% (MFN) | 0% (MFN) | 0% (MFN) | 0% (MFN) | 10% (MFN) |
| Hot-rolled steel (HS72.08) | 25% (232) | 25% | 25% (anti-dumping on Chinese producers) | 25% (EU-UK safeguard aligned) | 0% (quota-based) | 3.7–4.0% | 0% (quota limit) | 5–15% (safeguards) | 12.5% (avg bound) |
| Passenger cars (HS87.03) | 2.5% | 25% | 10% | 10% | 6.1% | 0% (most) | 8% | 5% | 60% (small cars) |
| Wheat (HS10.01) | 0% | 13% | ~8% | ~8% | 3% | 6% | 5% | 5% | 30% |
| Cotton apparel (HS62.05) | 16.5% | 17% | 11.6% | 8.6% | 18.0% | 8.4% | 9.9% | 10.0% | 10% |
| Aluminum (HS76.02) | 10% (232) | 15% | 6.5% | 6.5% | 7% | 4% | 8% | 0% | 15% |
Sources: WTO Tariff Profiles and national trade data. (The U.S. zero on phones comes from USTR statements. EU duties on Chinese EVs are 7.8–35.3% on top of 10%. India’s high tariffs are documented by USTR (e.g. overall MFN ~17%). Where exact codes vary, these are illustrative average rates.)
Strategies for Importers and Exporters
Businesses can mitigate tariff impacts through several tactical steps:
-
Diversify suppliers and routes: Sourcing products from countries with lower or preferential tariffs can dramatically cut costs. For example, U.S. importers might shift orders to Mexican or Canadian factories (under USMCA) instead of Asian suppliers. European buyers could source from EU–FTA partners (e.g. North African or ASEAN producers) to take advantage of trade agreements. In general, maintain multiple supplier options: if tariffs jump on one country, you can pivot to alternate origins.
-
Use free-trade agreements (FTAs): Wherever possible, route goods through FTA partners. Vietnam or Mexico have zero tariffs with key markets (ASEAN, CPTPP, USMCA). Shipments marked as “originating” in an FTA region can enter duty‐free or at reduced rates. (Note: FTA rules of origin must be strictly followed.) For example, companies selling to the U.S. can incorporate inputs from Mexico or Canada under USMCA duty‐free, while those exporting to Japan might use parts from ASEAN under RCEP.
-
Optimize Incoterms (DDP vs DDU): Understand shipping terms: under DDP (Delivered Duty Paid), the seller/shipper pays all tariffs and VAT up front, simplifying sales pricing and avoiding surprises for the importer. Under DDU (or DAP), the buyer is responsible for duties and clearance upon import. Sellers can advertise DDP pricing to customers to guarantee a delivered cost. CJdropshipping, for example, offers DDP fulfillment so that e-commerce sellers have duties included in one upfront fee, eliminating customs complexity on the buyer’s side.
-
Leverage warehousing in strategic zones: Storing inventory in low-tariff or FTA regions can save duties. CJdropshipping and similar logistics providers maintain global warehouses (e.g. in the EU, U.S., UAE, Vietnam). Importers can ship bulk inventory to these hubs and then fulfill local orders domestically. For instance, holding stock in an EU warehouse means EU‐bound sales incur no import duty, and U.S. exports sent to a U.S. warehouse avoid cross‐border tariffs. CJdropshipping’s blog specifically notes that warehousing in “tax‑friendly jurisdictions or free‑trade zones” is an effective duty‐reduction tactic.
-
Product reclassification and compliance: Use correct HS tariff codes and keep documentation. Small differences in classification can change duty rates (e.g. some bicycles vs. EVs). Where practical, consider minor product redesign to shift categories or increase declared value under an FTA threshold. Also stay alert for temporary tariff exclusions – the U.S. periodically exempts specific goods from tariffs via three‐year exclusions that companies can apply for.
-
Maintain flexible supply chains: Accelerate any on‑shore or near‑shore investment plans (e.g. partnering with domestic manufacturers). CJdropshipping’s supplier network, for example, can help e-tailers source the same products from factories in different countries. This flexibility allows a seller to import the same widget made in Vietnam or Mexico instead of China if needed.
CJdropshipping’s Solutions

CJdropshipping’s platform and services are well-suited to navigate this shifting tariff landscape. With global warehousing, CJdropshipping lets sellers pre-stock goods in locations such as the EU, U.S., UAE and Vietnam. By shipping end-orders from these local warehouses, merchants can avoid higher tariffs – effectively “manufacturing” origin under certain rules. CJdropshipping also offers a DDP shipping option, paying duties and VAT at import so that sellers can offer all-in pricing without import hassles. Its sourcing tools give sellers access to a wide network of vetted factories; for example, if tariffs rise on Chinese imports, a user could easily switch to suppliers in Vietnam or India via the platform. In short, CJdropshipping’s end-to-end fulfillment and sourcing platform is highlighted in industry guides as a way to “plan logistics” around tax regimes: warehousing goods in free-trade zones and handling delivery terms to minimize duties.
Staying Informed and Agile
The global tariff environment will keep evolving. Entrepreneurs should stay informed via WTO tariff trackers, trade press and government tariff lists. Use online tools (e.g. customs’ tariff lookups, FTZ databases, tariff‐line rebate programs) to quantify the impact on specific products. Leverage global supply‑chain software and services to monitor changes in real time. Platforms like CJdropshipping can serve as a connected supply‑chain hub – from localized warehousing to DDP delivery – enabling online retailers to adapt quickly.
Above all, maintain multiple supply routes and build flexibility into pricing. Use Free Trade Agreement provisions whenever possible, and consider small margins or relabeling to account for duties. By proactively using these strategies and partners, entrepreneurs can protect margins and remain competitive even under rising trade barriers. Despite headline tariff increases, cross-border e‑commerce still flourishes for those who diversify sources, invest in efficient logistics, and leverage tools like CJdropshipping’s network. In this changing trade environment, the key to success is agility: stay educated on policy shifts, keep an eye on data (such as the WTO tables above), and use global fulfillment solutions to turn tariff challenges into opportunities.